In today’s dynamic global marketplace, optimizing supply chains is paramount for business success. Supply chain analytics tools offer a powerful means to achieve this, providing businesses with the data-driven insights needed to make informed decisions, enhance efficiency, and boost profitability. These tools leverage advanced analytical techniques to transform raw data into actionable intelligence, revealing hidden patterns and predicting future trends.
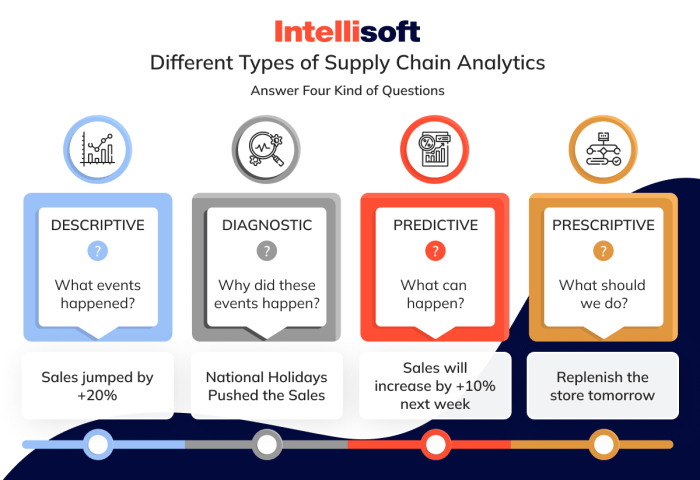
From predictive modeling to prescriptive analytics, a range of tools caters to diverse needs. Understanding the functionalities, benefits, and limitations of each tool is crucial for selecting the optimal solution for a specific business context. This exploration will delve into the various types of tools, their applications across industries, and the future trends shaping this rapidly evolving field.
Applications of Supply Chain Analytics Tools

Supply chain analytics tools are transforming how businesses operate, offering significant improvements in efficiency and profitability across various sectors. These tools leverage data-driven insights to optimize processes, reduce costs, and enhance overall supply chain resilience. Their applications span from strategic planning to daily operational tasks, impacting every stage of the product lifecycle.Supply chain analytics tools provide actionable intelligence, enabling proactive decision-making rather than reactive responses to unforeseen events.
This proactive approach minimizes disruptions, reduces waste, and ultimately boosts the bottom line. The integration of these tools allows for a more holistic view of the entire supply chain, facilitating better collaboration between different departments and stakeholders.
Real-World Examples of Supply Chain Analytics Tool Usage
Several companies successfully utilize supply chain analytics tools to enhance their operations. For instance, Walmart employs advanced analytics to optimize its vast logistics network, predicting demand fluctuations and ensuring timely product delivery to its stores. Similarly, Amazon leverages machine learning algorithms to forecast customer demand, manage inventory levels effectively, and optimize its delivery routes, minimizing transportation costs and delivery times.
These examples showcase how analytics contribute to both operational efficiency and improved customer satisfaction.
Impact on Inventory Management, Logistics, and Procurement
Supply chain analytics tools significantly improve inventory management by providing accurate demand forecasts. This reduces the risk of stockouts and overstocking, leading to optimized inventory levels and reduced warehousing costs. In logistics, these tools optimize transportation routes, consolidate shipments, and improve delivery schedules, resulting in cost savings and faster delivery times. Finally, in procurement, analytics aids in identifying the most cost-effective suppliers, negotiating better prices, and managing supplier relationships more effectively, minimizing procurement costs and ensuring timely supply.
Case Study: Implementing Supply Chain Analytics in the Food Industry
A large food processing company implemented a predictive analytics platform to optimize its perishable goods supply chain. By analyzing historical sales data, weather patterns, and transportation times, the platform accurately predicted demand fluctuations for its products. This enabled the company to adjust its production schedules, optimize inventory levels, and minimize waste due to spoilage. The result was a significant reduction in inventory holding costs and a marked improvement in on-time delivery rates.
The improved efficiency translated to a 15% increase in profitability within the first year of implementation. This success demonstrates the transformative potential of supply chain analytics, particularly in industries dealing with perishable goods where efficient management is critical.
Industries Heavily Reliant on Supply Chain Analytics
Several industries heavily depend on sophisticated supply chain analytics for their success. The following list highlights five such industries and the reasons for their reliance:
The effectiveness of supply chain analytics is particularly crucial in these sectors due to the complexity of their operations, the high value of their products, and the sensitivity to disruptions.
- Retail: High volume, diverse product range, and fluctuating demand necessitate precise forecasting and efficient inventory management.
- Manufacturing: Complex production processes, global supply chains, and stringent quality control demand real-time visibility and optimized logistics.
- Healthcare: Time-sensitive delivery of pharmaceuticals and medical supplies requires precise planning and efficient distribution networks.
- E-commerce: Fast-paced order fulfillment, complex logistics, and customer expectations demand optimized delivery and reverse logistics processes.
- Food and Beverage: Perishable goods, strict quality standards, and temperature-sensitive transportation necessitate efficient inventory management and optimized logistics.
Key Performance Indicators (KPIs) in Supply Chain Analytics
Effective supply chain management relies heavily on the consistent monitoring and analysis of key performance indicators (KPIs). These metrics provide crucial insights into the efficiency, effectiveness, and overall health of the supply chain, enabling proactive adjustments and continuous improvement. By tracking these KPIs, businesses can identify bottlenecks, optimize processes, and ultimately enhance profitability.
KPIs are calculated using data collected from various points throughout the supply chain, including procurement, manufacturing, logistics, and distribution. The interpretation of these KPIs involves comparing current performance against historical data, industry benchmarks, and pre-defined targets. This comparison helps to pinpoint areas needing improvement and to measure the success of implemented strategies.
Inventory Turnover
Inventory turnover measures how efficiently a company utilizes its inventory. A higher turnover rate generally indicates efficient inventory management, minimizing storage costs and reducing the risk of obsolescence. It’s calculated as the cost of goods sold divided by the average inventory value. For example, a company with a cost of goods sold of $1 million and an average inventory value of $200,000 has an inventory turnover of 5.
This suggests the company sells and replaces its inventory five times a year. Supply chain analytics tools can automatically calculate this KPI using real-time inventory data and sales figures.
On-Time Delivery Rate
This KPI measures the percentage of orders delivered on or before the promised delivery date. A high on-time delivery rate signifies reliable and efficient logistics operations. It’s calculated by dividing the number of on-time deliveries by the total number of deliveries, then multiplying by 100 to express it as a percentage. For instance, if 950 out of 1000 deliveries are on time, the on-time delivery rate is 95%.
Supply chain management software can track shipments, monitor delivery schedules, and automatically calculate this KPI.
Order Fulfillment Cycle Time
This KPI represents the total time taken to fulfill an order, from receiving the order to delivering the product to the customer. A shorter cycle time indicates efficient order processing and faster delivery. It is calculated by measuring the time elapsed between order placement and delivery. For example, if an order is placed on Monday and delivered on Wednesday, the order fulfillment cycle time is two days.
Advanced analytics platforms can integrate data from various systems to provide a real-time view of the order fulfillment cycle.
Perfect Order Rate
This KPI measures the percentage of orders that are delivered completely and accurately, without any errors or delays. A high perfect order rate signifies exceptional supply chain performance. It’s calculated by considering multiple factors including on-time delivery, complete orders, accurate invoicing, and no damage during transit. For example, if 980 out of 1000 orders meet all these criteria, the perfect order rate is 98%.
Supply chain analytics tools can track these individual aspects of order fulfillment and aggregate the data to compute this comprehensive metric.
Visual Representation of KPI Relationships
Imagine a dashboard displaying several interconnected gauges. The central gauge represents the overall customer satisfaction score. Connected to it are gauges representing On-Time Delivery Rate, Order Fulfillment Cycle Time, and Perfect Order Rate. These gauges are all directly influenced by the Inventory Turnover rate, depicted as a separate gauge connected to the others. A higher Inventory Turnover rate generally leads to improved On-Time Delivery, reduced Order Fulfillment Cycle Time, and a higher Perfect Order Rate, ultimately increasing customer satisfaction.
The dashboard would visually illustrate how improvements in one KPI can positively impact others, creating a holistic view of supply chain performance. The color-coding of the gauges would instantly highlight any underperforming areas, facilitating immediate attention and corrective action.
Data Sources for Supply Chain Analytics
Effective supply chain analytics relies heavily on the availability and quality of data. This data comes from a diverse range of sources, both internal to the organization and external, encompassing various formats and levels of detail. Understanding these sources, the challenges they present, and the methods used to prepare this data for analysis is crucial for gaining valuable insights and optimizing supply chain performance.
Data for supply chain analytics is drawn from a wide array of sources, each offering a unique perspective on different aspects of the supply chain. These sources can be broadly categorized as internal and external. Internal sources provide detailed, operational data, while external sources offer broader market and economic context. Successfully integrating these diverse sources is key to creating a comprehensive view of the supply chain.
Internal Data Sources
Internal data sources represent the core operational information of a company’s supply chain. These sources often contain highly detailed and granular data that is crucial for understanding day-to-day performance. Examples include Enterprise Resource Planning (ERP) systems, Customer Relationship Management (CRM) systems, Warehouse Management Systems (WMS), Transportation Management Systems (TMS), and Manufacturing Execution Systems (MES). ERP systems, for instance, provide data on inventory levels, production schedules, and procurement activities.
CRM systems track customer orders and interactions, while WMS and TMS systems monitor warehouse operations and logistics. MES provides real-time data from the manufacturing floor. The richness and depth of this data make it a cornerstone of effective supply chain analytics.
External Data Sources
Beyond internal systems, external data providers offer valuable context and insights that enhance the analytical capabilities. These external sources often provide macroeconomic data, market trends, and competitor information. Examples include market research firms (like Nielsen or IRI), weather data providers (like AccuWeather), and freight rate indices (like the DAT Freight & Analytics report). Market research data helps to understand consumer demand and trends, influencing inventory planning and product development.
Weather data plays a crucial role in anticipating potential disruptions to transportation and logistics, while freight rate indices help in cost forecasting and negotiation. Integrating this external data into the analysis enriches the insights derived from internal sources, providing a more holistic view of the supply chain.
Data Integration Challenges
Integrating data from diverse internal and external sources presents significant challenges. Data may exist in different formats (e.g., CSV, XML, JSON), use varying units of measurement, and have different levels of granularity. Inconsistencies in data definitions and naming conventions also complicate integration. Furthermore, data quality issues, such as missing values, inaccuracies, and inconsistencies, are prevalent across various sources.
Addressing these challenges requires robust data governance, standardization procedures, and data cleaning techniques.
Data Cleaning, Transformation, and Preparation
Before analysis can begin, the collected data must undergo a thorough cleaning, transformation, and preparation process. This involves several key steps:
- Data Cleaning: This involves identifying and handling missing values, outliers, and inconsistencies. Missing values can be imputed using various methods, such as mean imputation or regression imputation. Outliers can be removed or adjusted depending on the context. Inconsistencies in data definitions and formats need to be addressed through standardization.
- Data Transformation: This step involves converting data into a suitable format for analysis. This may include data type conversions (e.g., converting text to numerical data), creating new variables, and aggregating data. For instance, daily sales data might be aggregated to weekly or monthly figures for trend analysis.
- Data Preparation: This final step involves preparing the data for the specific analytical techniques to be used. This may involve scaling data, creating dummy variables for categorical variables, and handling multicollinearity.
Step-by-Step Data Integration Procedure
A systematic approach is needed to integrate data from different sources into a unified platform. This typically involves the following steps:
- Data Discovery and Profiling: Identify all relevant data sources and understand their structure, format, and content. This includes assessing data quality and identifying potential challenges.
- Data Standardization: Establish common data definitions, formats, and units of measurement across all sources. This may involve creating data dictionaries and mapping different data fields to common standards.
- Data Extraction and Transformation: Extract data from each source using appropriate tools and techniques (e.g., ETL tools). Transform the data to match the standardized format using techniques like data cleaning, data transformation, and data validation.
- Data Loading and Integration: Load the transformed data into a unified data warehouse or data lake. This involves using appropriate database technologies and ensuring data consistency and integrity.
- Data Validation and Quality Assurance: Validate the integrated data to ensure accuracy, completeness, and consistency. This may involve running data quality checks and performing data profiling.
Future Trends in Supply Chain Analytics Tools
The field of supply chain analytics is rapidly evolving, driven by advancements in technology and the increasing need for greater efficiency and resilience. Emerging technologies are transforming how businesses collect, analyze, and utilize data to optimize their supply chains, leading to significant improvements in forecasting accuracy, inventory management, and risk mitigation. This section will explore some key future trends shaping the landscape of supply chain analytics.
The Impact of Artificial Intelligence and Machine Learning
Artificial intelligence (AI) and machine learning (ML) are revolutionizing supply chain analytics by enabling more sophisticated predictive modeling and automation. AI algorithms can analyze vast datasets to identify patterns and anomalies that would be impossible for humans to detect, leading to more accurate demand forecasting and improved inventory optimization. Machine learning models can continuously learn and adapt to changing market conditions, enabling businesses to respond more effectively to disruptions and optimize their supply chain operations in real-time.
For example, ML algorithms can predict potential delays in shipments based on historical data and real-time information such as weather patterns and traffic conditions, allowing companies to proactively adjust their plans and minimize disruptions. This leads to significant cost savings and improved customer satisfaction.
Challenges and Opportunities in Adopting New Technologies
The adoption of AI and ML in supply chain analytics presents both challenges and opportunities. One significant challenge is the need for high-quality data. AI and ML algorithms require large amounts of clean, accurate data to function effectively. Companies may need to invest in data cleaning and integration processes to ensure the quality of their data. Another challenge is the need for skilled personnel to develop, implement, and manage these complex systems.
Finding and retaining data scientists and AI specialists can be difficult and expensive. However, the potential rewards are substantial. Companies that successfully adopt these technologies can gain a significant competitive advantage by improving their efficiency, reducing costs, and enhancing their resilience. The opportunity lies in creating more agile and responsive supply chains capable of adapting to the ever-changing global landscape.
Potential Future Developments in Supply Chain Analytics
The future of supply chain analytics is promising, with several key developments on the horizon.
- Predictive Maintenance and Optimization: AI-powered systems will increasingly be used to predict equipment failures and optimize maintenance schedules, reducing downtime and improving operational efficiency. Imagine a system that analyzes sensor data from factory equipment to predict when a component is likely to fail, allowing for proactive maintenance before a costly breakdown occurs. This proactive approach minimizes disruptions and reduces overall maintenance costs.
- Digital Twin Technology: Digital twins—virtual representations of physical assets and processes—will become increasingly sophisticated, allowing for more accurate simulations and scenario planning. This allows businesses to test different strategies and optimize their supply chains in a virtual environment before implementing them in the real world, minimizing risks and maximizing efficiency. For instance, a company could use a digital twin to simulate the impact of a natural disaster on its supply chain and develop contingency plans accordingly.
- Blockchain Technology for Enhanced Transparency and Traceability: Blockchain technology will enhance transparency and traceability throughout the supply chain, providing greater visibility into product origins, movement, and authenticity. This improved transparency builds trust and accountability among stakeholders, reduces the risk of counterfeiting, and improves product recall efficiency. A system tracking the journey of a product from origin to consumer, recording every transaction and location, would provide increased security and traceability.
The Supply Chain
The modern supply chain is a complex network encompassing the flow of goods, services, information, and finances from origin to final consumption. Understanding its intricacies is crucial for optimizing efficiency, mitigating risks, and achieving competitive advantage. This section delves into the core components of a modern supply chain, the challenges inherent in global operations, and the paramount importance of effective collaboration.
Core Components of a Modern Supply Chain
A modern supply chain typically involves several key components working in concert. These include sourcing and procurement, production and manufacturing, inventory management, logistics and transportation, and finally, distribution and sales. Effective management of each component is vital for overall supply chain performance. Sourcing involves selecting and managing suppliers, while procurement handles the actual purchasing of materials. Production transforms raw materials into finished goods, and inventory management aims to balance supply and demand.
Logistics encompasses the movement of goods, while distribution ensures timely delivery to end customers.
Challenges and Risks in Global Supply Chain Management
Managing a global supply chain presents unique challenges and significant risks. Geopolitical instability, natural disasters, pandemics (like the COVID-19 outbreak), and trade wars can all severely disrupt supply chains, leading to delays, shortages, and increased costs. Furthermore, managing diverse regulatory environments, varying cultural norms, and logistical complexities across different countries adds significant layers of complexity. For instance, the Suez Canal blockage in 2021 highlighted the vulnerability of global supply chains to unforeseen events, causing significant disruptions to shipping and impacting countless businesses worldwide.
Importance of Collaboration and Communication in Supply Chains
Effective collaboration and communication are absolutely essential for successful supply chain management. Open communication channels between all stakeholders – suppliers, manufacturers, distributors, retailers, and customers – are critical for sharing information, coordinating activities, and responding swiftly to disruptions. Real-time data sharing, collaborative planning, and joint problem-solving can significantly enhance responsiveness and resilience. A lack of communication and coordination can lead to inefficiencies, delays, and ultimately, dissatisfied customers.
For example, a retailer lacking communication with its supplier about an upcoming promotional event could lead to stockouts and lost sales.
Comparison of Lean and Agile Supply Chain Models
Lean and agile supply chains represent two distinct approaches to managing the flow of goods. Lean emphasizes efficiency and waste reduction through continuous improvement, aiming for a streamlined and optimized process with minimal inventory. Toyota’s production system is a prime example of lean principles in action. In contrast, agile supply chains prioritize flexibility and responsiveness to changing market demands.
They focus on adapting quickly to unexpected events and customizing products to meet specific customer needs. Companies operating in highly volatile markets, such as fashion or electronics, often adopt agile strategies. While seemingly contrasting, many companies integrate elements of both lean and agile approaches to create a hybrid model tailored to their specific needs and industry context.
Ultimately, the effective utilization of supply chain analytics tools empowers businesses to navigate the complexities of the modern supply chain with greater agility and precision. By leveraging data-driven insights, companies can proactively mitigate risks, optimize resource allocation, and improve overall operational performance. The future of supply chain management is inextricably linked to the continued advancement and adoption of these powerful analytical tools, paving the way for a more efficient, resilient, and profitable business landscape.
Question Bank
What is the cost of implementing supply chain analytics tools?
Costs vary widely depending on the chosen tool, its features, implementation complexity, and ongoing maintenance. Some solutions offer subscription-based models, while others require upfront investment.
How long does it take to see a return on investment (ROI) from these tools?
ROI timelines depend on factors such as data quality, implementation effectiveness, and the specific business goals. Some companies see immediate improvements, while others may experience a longer timeframe.
What skills are needed to effectively use supply chain analytics tools?
Users should possess a basic understanding of data analysis and interpretation. Specialized skills may be required depending on the tool’s complexity, including programming (e.g., Python, R) and statistical modeling.
What are the potential risks associated with using these tools?
Risks include data security breaches, inaccurate data leading to flawed insights, and the high cost of implementation and maintenance. Proper data governance and rigorous validation processes are crucial to mitigate these risks.


